


Case Study • Renewable Energy Portfolio Intelligence
A €1.24M penalty, defused three weeks before the deadline that would have locked it in
- Client
- SolarX (proxy name)
- Industry
- Renewable Energy
- Service
- AI Solutions|Data Analytics
One portfolio, five countries, one action queue
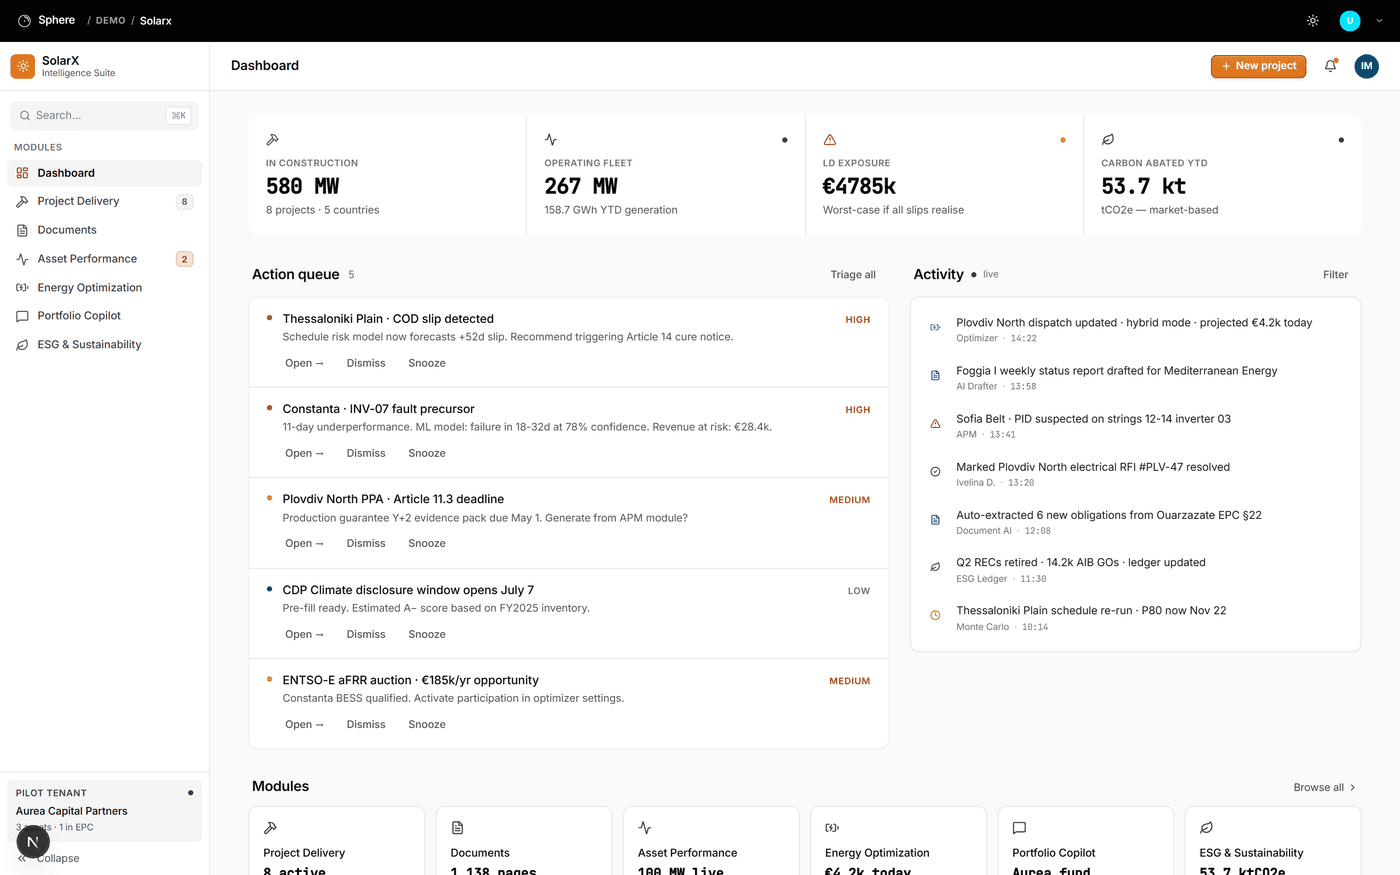
It's a Tuesday morning inside SolarX's Intelligence Suite. Across five countries — Bulgaria, Greece, Romania, Italy, Morocco — the platform is watching €405M of contracted solar and storage value: 8 projects moving through construction and 267 MW already energized and selling power, across SolarX's own portfolio. One portfolio manager can't personally chase all of it — different phases, hundreds of pages of EPC contracts and PPAs, a wholesale price curve that swings from €18/MWh at 2pm to €102/MWh at 8pm. Six AI desks run continuously against that sprawl, and this morning's action queue already has 5 items waiting, ranked by what they're worth.
Three risks caught while there was still time to act
A field report on SolarX's Intelligence Suite, narrated across one representative day inside SolarX's five-country solar and storage portfolio: six AI desks — project delivery, asset performance, documents, energy optimization, portfolio finance, and ESG — watching €405M of contracted project value so one portfolio manager doesn't have to chase it module by module.
1. A 52-day slip, caught the moment the data changed
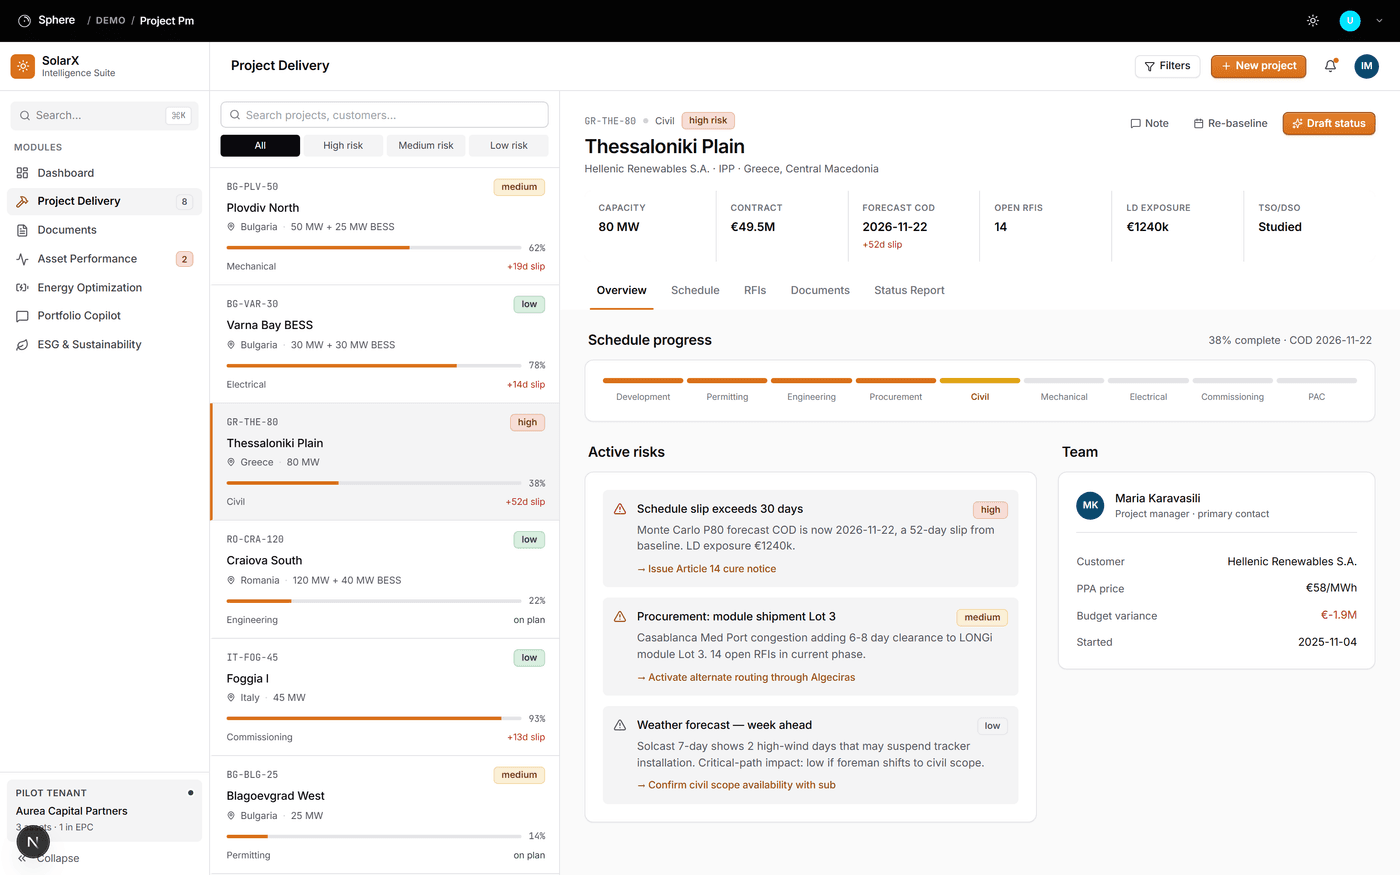
Top of the queue: Thessaloniki Plain, an 80 MW IPP project in Greece for Hellenic Renewables, 38% through civil works. The schedule desk re-runs its Monte Carlo model every time site data updates, and this run moves the P80 completion date to November 22 — a 52-day slip against the contracted date, alongside 14 open RFIs and a budget already €1.85M over. At that slip, the EPC contract's liquidated-damages clause exposes the portfolio to €1.24M once the cure-notice window closes. The desk doesn't stop at the flag — it recommends issuing the Article 14 cure notice now, three weeks ahead of that deadline, as a one-click action sitting right next to the risk that triggered it.
2. A fault that's invisible in a monthly report
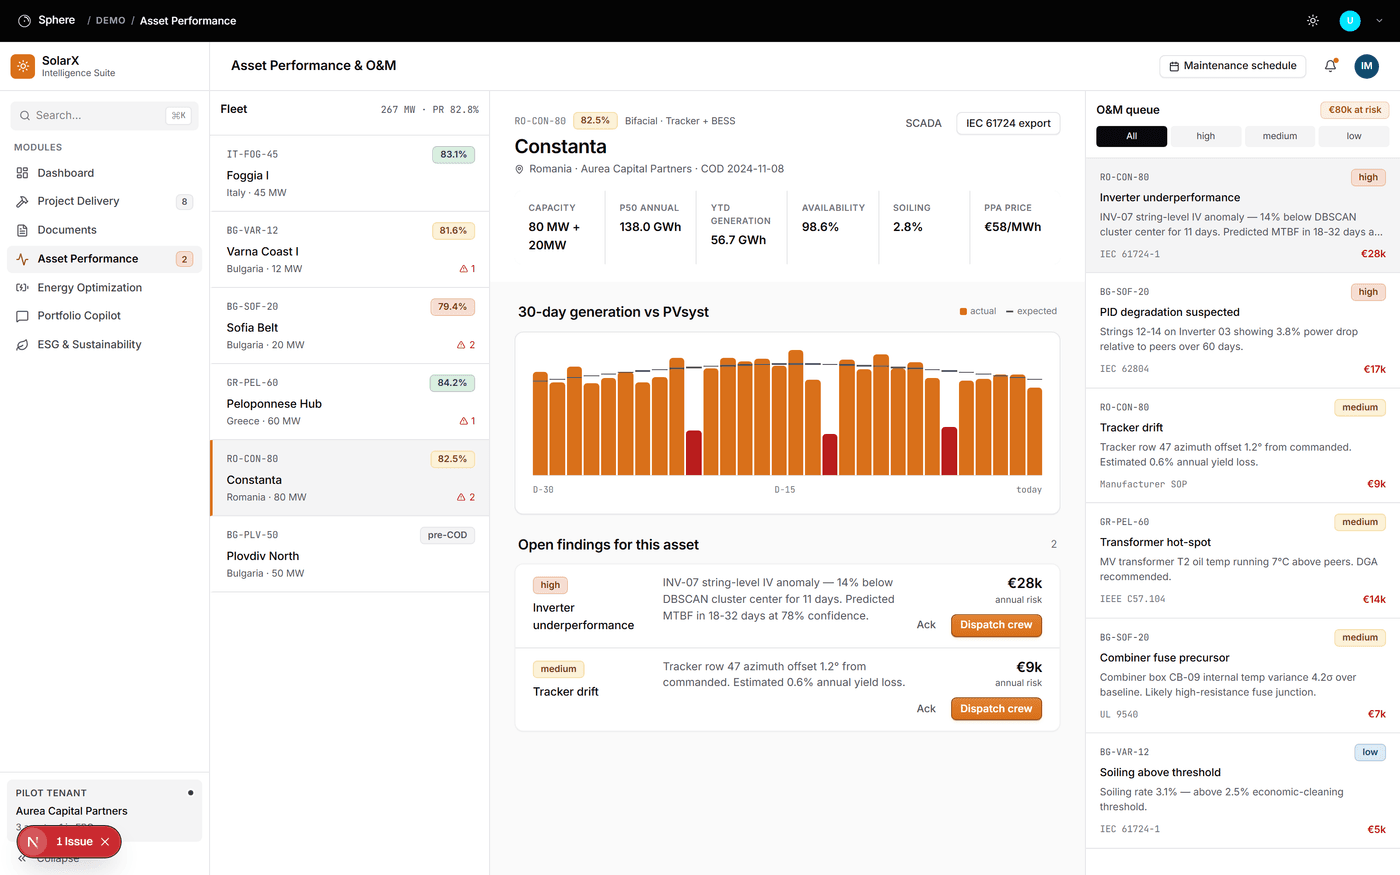
Further down: Constanta, an 80 MW-plus-BESS asset in Romania, already energized and selling power at an 82.5% performance ratio. Inverter INV-07 has been running 14% below its peer cluster for 11 days — invisible in a monthly O&M report, obvious to a model watching every string every day. The failure model puts the actual trip 18 to 32 days out at 78% confidence, €28k of annual revenue at risk. Instead of an emergency callout after the inverter trips, today's recommendation is a scheduled IV curve and IR scan — routine work, on a routine truck roll, dispatched with one click.
3. A three-point PR gap, answered in one message
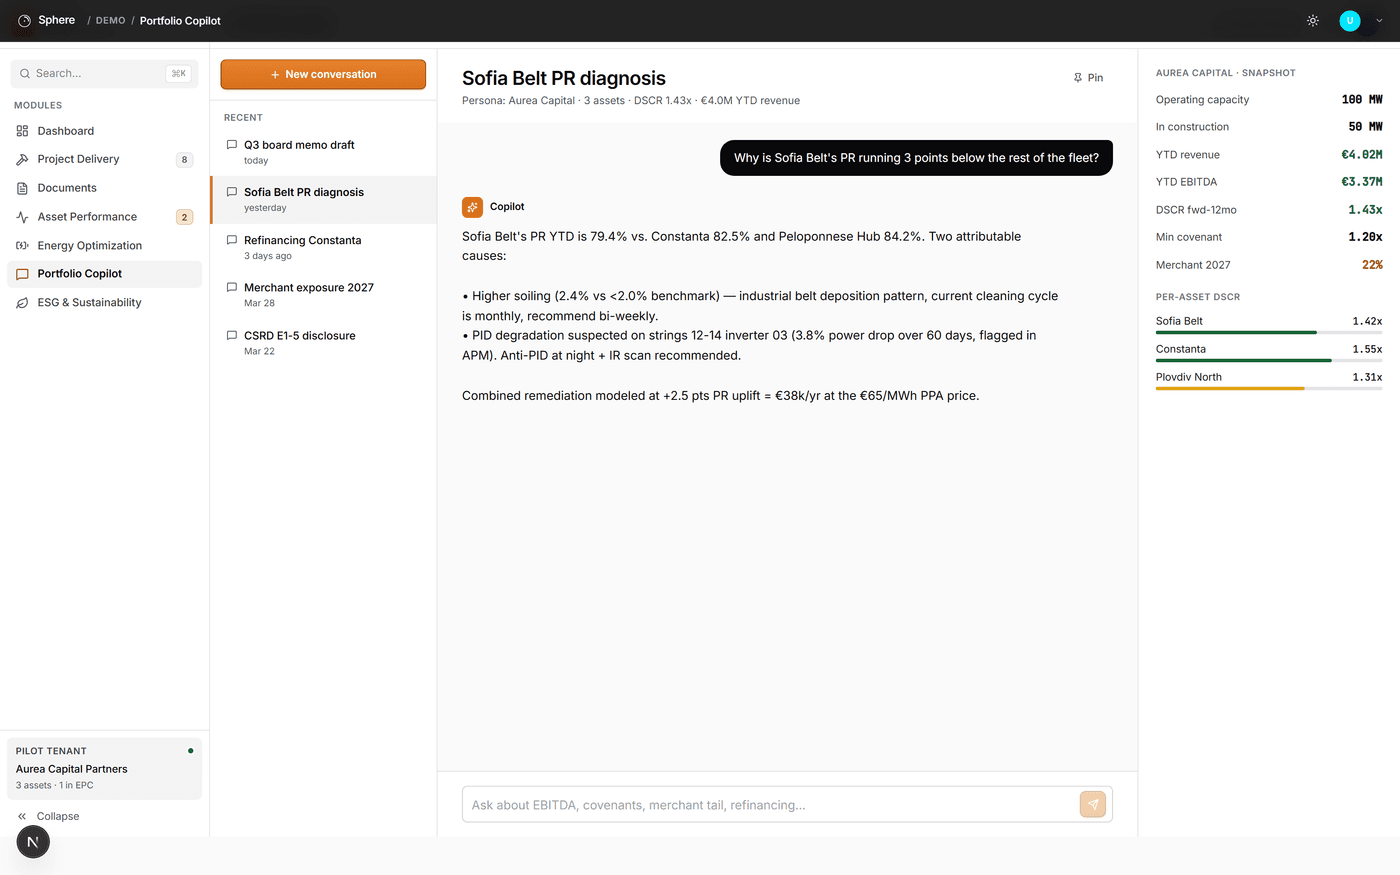
Yesterday, someone on the asset management team asked Portfolio Copilot a plain question: why is Sofia Belt's performance ratio running three points below the rest of the fleet? The answer came back in one message, not a week of pulling SCADA exports: higher soiling than benchmark, plus suspected PID degradation on two strings, together worth 2.5 points of PR — modeled at €38k a year at Sofia Belt's PPA price. The same panel that answers the question is already tracking the number that matters most upstream, to SolarX: DSCR at 1.43x forward-12-month, against a 1.20x covenant floor.
By this morning, and across the portfolio
By the time the portfolio manager works through this morning's queue, a €1.24M penalty is defused three weeks ahead of the deadline that would have locked it in, an inverter failure is booked as scheduled maintenance instead of an emergency callout, and a three-point performance gap has a €38k-a-year answer attached to it — without pulling a single project engineer off their actual job to build a spreadsheet.
Zoom out to the full portfolio: €4.8M of liquidated-damages exposure is tracked in real time across all 8 projects instead of surfacing at the next steering call, and the fleet-wide revenue-at-risk the model is watching sits at €80k — small next to the €405M of contracted value it's protecting.
“We used to find out about a schedule slip in the monthly steering call, three weeks after the window to do anything about it had already started closing. Now the model tells us the day the data changes — and drafts the notice.”
Why this matters to SolarX's returns
Penalties defused before they're contractual, not after
LD exposure is tracked continuously against real schedule data, so the cure-notice window gets used while it is still open — €4.8M of exposure actively managed across the portfolio.
Unplanned outages become scheduled maintenance
Predictive failure windows, 18–32 days out, turn a 2am emergency callout into routine dispatched work — protecting both revenue and crew logistics.
Performance questions come back with a dollar figure attached
Portfolio Copilot turns “why is this asset underperforming” into a costed fix in one message — the alternative is a week of analyst time pulling SCADA exports by hand.
One view across five countries and dozens of contracts
Document intelligence reads PPAs and EPC contracts in EN/BG/EL/RO/IT/AR and surfaces the clauses that matter — production guarantees, LD triggers, cure windows — without a lawyer re-reading 1,138 pages by hand.
Covenant headroom is a number you already have
DSCR, per-asset coverage, and merchant exposure sit one message away from the same operating data the other five desks already use — no scrambling together a covenant packet the night before the lender call.
How this report was built
“SolarX” is a proxy name for the client, used at their request — not the real company name. Portfolio, projects, and figures shown are modeled on real Balkan/MENA utility-scale solar economics as a representative scenario; screenshots are captured directly from the working build and relabeled.
Organizations around the world trust us


Hear from
our clientsHear from our clients

Lee Ebreo
VP of Engineering at Credit Ninja
These things would not have been achievable if we did not build our own in-house system and if we did not partner with Sphere to help us achieve our goals.

Selah Ben-Haim
VP of Engineering at Prominence Advisors
Our experience with Sphere and their team has been and continues to be fantastic. We keep throwing new projects at them, and they keep knocking them out of the park (including the rescue of a project that was previously bungled by another vendor).

Ben Crawford
Senior Product Manager at Enova Financial
I would expect to be delighted. It's been a really positive experience, working with Sphere, and I would expect you to have the same.

Mark Friedgan
CEO at CreditNinja
Sphere consistently prioritizes the needs of their clients, demonstrating both agility and teamwork. As an offshore team, they have been an integral part of our organization and we plan to continue growing with them.

René Pfitzner
Co-Founder at Experify
Sphere provided excellent full-stack development manpower to augment our team and help push our product forward. They are easy to work with, tech-savvy and proactive.

Bruce Burdick
Chief Information Officer at Integra Credit
We've been working with Sphere and its excellent consultants since our founding. I've found that they are true partners in the success of our business.

Jemal Swoboda
CEO at Dabble
The resources and developers that Sphere Software provides are skilled and have the required technical expertise, but more importantly, they have helped us build a culture of excellence within our team.

Arthur Tretyak
Founder and CEO at IntegraCredit
With Sphere, we were able to migrate in half the time it would take to train an additional FTE… and for a fraction of the cost. Our experience with Sphere has been exceptional.
Lee Ebreo
VP of Engineering at Credit Ninja
These things would not have been achievable if we did not build our own in-house system and if we did not partner with Sphere to help us achieve our goals.
Selah Ben-Haim
VP of Engineering at Prominence Advisors
Our experience with Sphere and their team has been and continues to be fantastic. We keep throwing new projects at them, and they keep knocking them out of the park (including the rescue of a project that was previously bungled by another vendor).

TOP AI CODE GENERATION COMPANY UNITED STATES 2025

TOP AI TEXT GENERATION COMPANY FLORIDA 2025

TOP APP DEVELOPMENT COMPANY MANUFACTURING 2025

TOP ARTIFICIAL INTELLIGENCE COMPANY UNITED STATES 2025

TOP CHATBOT COMPANY UNITED STATES 2025

TOP RECOMMENDATION SYSTEMS COMPANY UNITED STATES 2025

GLOBAL RECOGNITION AWARDS 2026

BEST IN AI FOR DOCUMENTATION VALIDATION 2026

BEST IN AI POWERED INVOICE AUDITING 2026

GLOBAL TECH WINNER 2026

MOST INNOVATIVE TECHNOLOGY CONSULTING FIRM 2026

GLOBAL GENERATIVE AI AWARD 2026 WINNER
Talk to Sphere about your solar and storage portfolio
Tell us a bit about your portfolio and our team will get back to you promptly.